Technical Tips is a new article series that will discuss more complex subjects that relate to digital marketing strategy, measurement, and analytics. In this new series, we’ll look at industry best practices and provide step-by-step guides to get you and your organization or business on the fast track to digital marketing success. If you have questions or comments relating to any of the content published, we encourage you to post your thoughts in the comments section at the the bottom of the page.
Most people who’ve spent a reasonable amount of time in Google Analytics (GA) have, at some point or another, taken a stab at building custom GA dashboard. We have a love-hate relationship with Google Analytics’ built-in custom dashboard tool. We tended to use it mostly out of convenience, as it provided some level of customization, but it’s honestly quite limited in what it can do, especially in terms of aesthetics.
Say Hello to Data Studio
Earlier this year, Google decided to make its dashboard and visualization platform (Data Studio) available to non-enterprise clients. Data Studio is everything that the native custom GA dashboards are not. They’re customizable, flexible, and sexy!
Fully Customizable
With Data Studio, you have complete control over the design and layout of your dashboard. Do you want to go with a blue and red theme? No problem! Do you want a bar chart instead of a line chart? You got it! How about a dashboard with 20 miniaturized charts? We’re not recommending this, but, we can make that happen!
Intuitive
You don’t need to be a coder or database administrator to set up a new dashboard in Data Studio. All you need is a little bit of time– we promise. Google has done a fantastic job of creating a tool that is very easy to navigate and learn. Since it’s a Google product, there are a ton of resources like help videos, articles, and shared templates that are already posted across the web.
We’ve posted a short instructional video at the end of the article that will walk you through creating your first dashboard in Data Studio.
Flexible
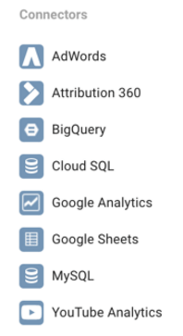
In order to build a custom GA dashboard in Data Studio, you need to first connect a new data source (don’t worry, it’s a lot easier than it sounds). Google includes a variety of different connection types like AdWords, Youtube Analytics, Google Analytics, Google Sheets, and more. Often times, Google structures data in a way that makes it difficult or impossible to visualize, which was one of our major pet peeves with the old custom dashboards. Now you can simply use the super popular Google sheets analytics plugin (see here) to build custom reports, which can then be used to power your Data Studio dashboards. With the Google sheets plugin, you can also schedule the report to refresh on a daily basis so that your dashboard stays up to date.
If you subscribe to a service like Supermetrics for Google sheets, you could conceivably build custom dashboards for Facebook, Instagram, Twitter, and many other data sources. You can even create charts and data visualizations from different data sources within the same dashboard if you so desire.
The current Data Type Connectors in Data Studio include:

An Awesome Tool
In conclusion, we love Data Studio and think it is a totally awesome tool. It may not come with all of the bells and whistles of Tableau, and there are still some limitations that we’re learning to deal with (it would be really keen if we could add different data sources to the same chart!), but remember, Google is offering this tool for free! What we love most about Data Studio is that like most Google apps, it’s incredibly easy to share with your peers.
Get Started Today
To get started building your first dashboard in Data Studio, check out our short instructional video below that will show you how to connect Data Studio to your Google Analytics account and begin creating your first custom dashboard today!

