
In August, we had the pleasure of hosting a breakout session at the Tessitura Learning & Community Conference (TLCC) in Orlando, FL. MogoARTS’ Managing Director, Samantha Bryant co-presented with Howard Levine, VP of Marketing & Guest Services at State Theatre New Jersey (STNJ). The two put together a comprehensive session outline on how to use Tessitura to analyze patron buying behaviors by product type, seasonality, genre, etc.; and how to mirror marketing strategies and channels that complement different audience behaviors.
BACKGROUND
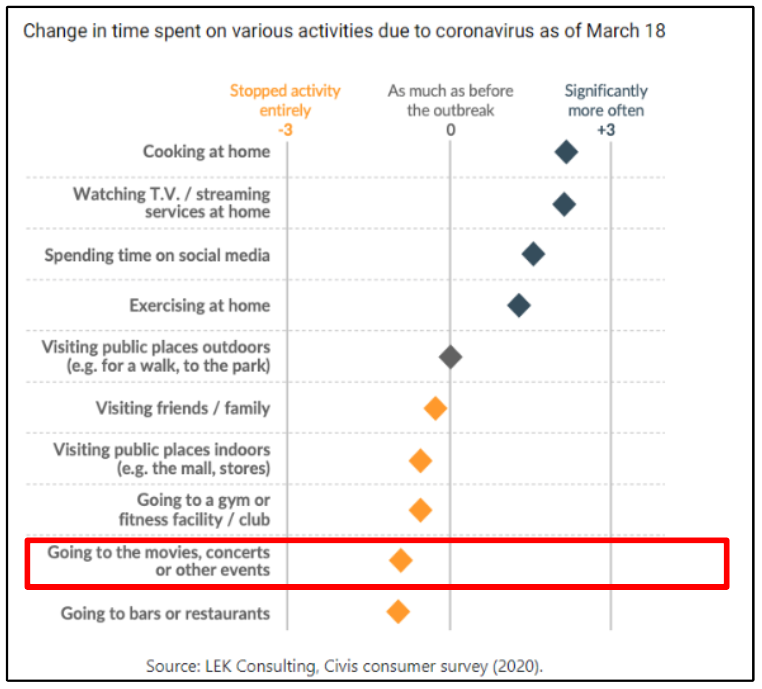
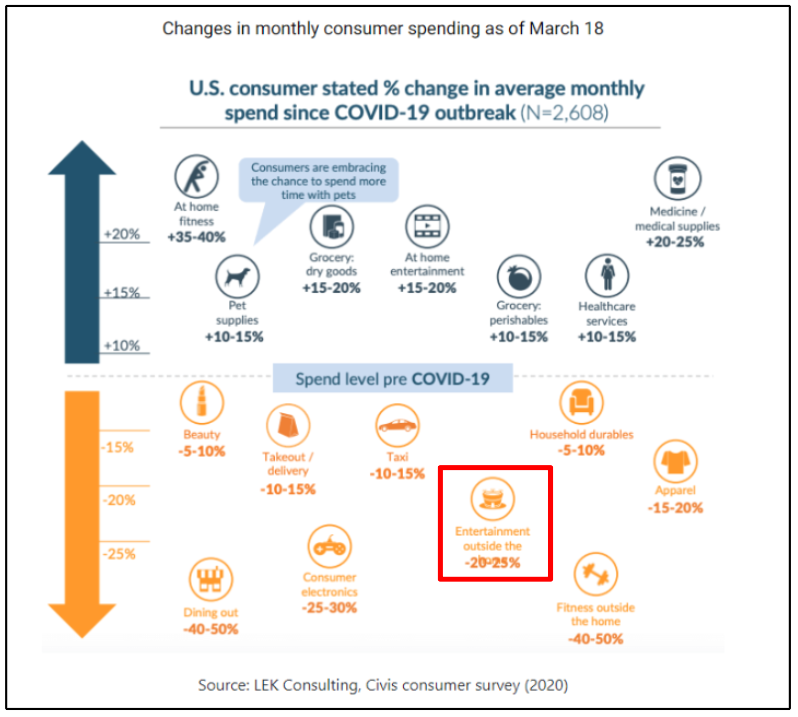
First, we must set the scene; it is no secret the COVID-19 pandemic changed the way patrons spend their time and money. Even though consumers were spending considerably more of their money online than before the COVID-19 outbreak, that spending has shifted. Research and data suggest that the money being spent online is a redistribution of aspects of traditional offline spending. Other purchases are being deferred or cancelled entirely. Going to movies, concerts or other events fell into the “stopped activity entirely” column, and entertainment outside the home dropped 20-25% from what was being spent pre-COVID.
Recent survey data from the Patron Perspective Buyer Report tells us more about patron buying frequency. Before the pandemic, 89% of survey respondents said they went to the theatre three or more times per year. We also saw that 73% of respondents to this survey said they purchased tickets one month or more in advance of an event. There are many factors which contribute to the timing of a purchase such as popularity, run time, ticket price, audience loyalty, seasonality, etc. But the takeaway is clear, patrons are not buying months in advance.
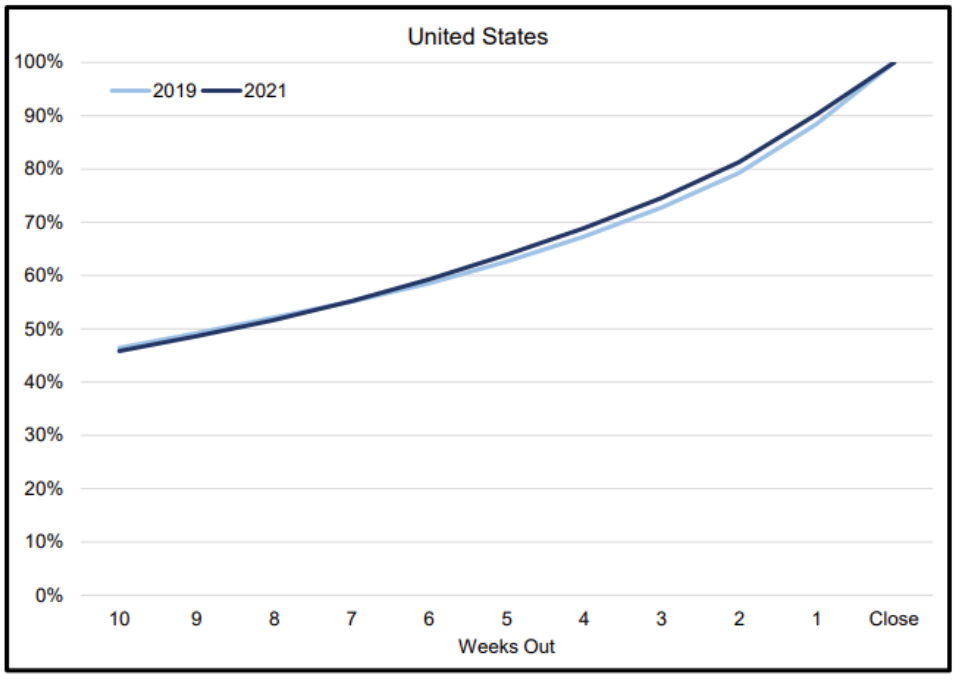
A national survey conducted by TRG Arts analyzes average booking patterns from 10 weeks before the final performance of a run at a venue or the maturity of a single performance. In both 2019 and 2021, 46% of the final revenue had been achieved by 10 weeks out. Patterns remain remarkably similar throughout the following weeks. In 2019, 12% of revenue was achieved in the final week of sales. In 2021 this dropped to 10%. What is interesting for the story of this chart is how much things have bounced back to pre-covid buying patterns altogether on an aggregate view. Take note that this survey is not segmented by market, venue type, genre or time of year and will impact buying patterns when looked at in more specific views.
Lastly, it is important to understand how your patrons are purchasing: online, at the box office, over the phone, etc. Knowing where sales are correlated can help manage expectations of the results of your marketing strategies. For example, if you have a high volume of purchases over the phone for subscriptions (so patrons can ask questions, etc.) do not expect your digital strategies to correlate those sales – instead look at additional KPIs (Key Performance Indicators) such as phone traffic, offline sales, visits and/or clicks on the contact us page, etc.
ANALYZE YOUR AUDIENCE
The best way to understand your patron’s buying patterns is to look directly at data from your database (such as Tessitura) to segment audience behavior. For example, STNJ is a performing arts venue which hosts various event types – so they started by looking at their largest genres. For the most recent season they saw that Concerts followed by Broadway were their highest selling event types. They also look at sales patterns such as subs vs regular vs. discounts as well as sales channels. Both by season and by production.
Analysis by production also includes revenue makeup/loss to discounts. Attendee segments such as new to file, second-time attendee, 3+ time attendee, subscriber; as well as running sale totals by date. Additionally, STNJ looks at where buyers come from and income levels and if children are present in their household and at what age. This helps get an idea how to better market this show as well as similar shows in the future.
When looking specifically at a Broadway Tour buying patterns pre- and post-pandemic STNJ compared similar titles in December 2018 and January 2023. Pre-pandemic, there was a huge spike at the on-sale announcement and a steady sales pattern with a slight increase 3-4 weeks ahead of opening. Compared to 2023, the on-sale spike is still present but nowhere near as high as 2018 and continues to see sales increase in the 2-3 weeks ahead of opening showing the delayed nature of a Broadway buyer.
Additionally, STNJ looked at similar family/children’s programming pre- and post-pandemic. Again, in 2018 they saw a large sales spike at the on-sale announcement and a relative steady pattern leading to the opening. The biggest change being in 2023 seeing no spike at the on-sale and sales remain steady but low until a large spike 4 weeks out from opening as well as the week of the show starting. Parents aren’t bothering buying or planning far in advance with family programming – likely due to kids being sick more frequently, they don’t want to commit until they know the family can attend.
Any ticket-sales organization can look at their CRM (Customer Relationship Management) database to analyze buying patterns and create a persona with behavioral assumptions to help inform exactly how and when to market to these patrons.
IDENTIFY THE BEST MEDIA STRATEGIES
All forms of media have ideal placements for specific types of engagement. It is best to start by looking at a marketing funnel and identifying different outcomes from different media channels.
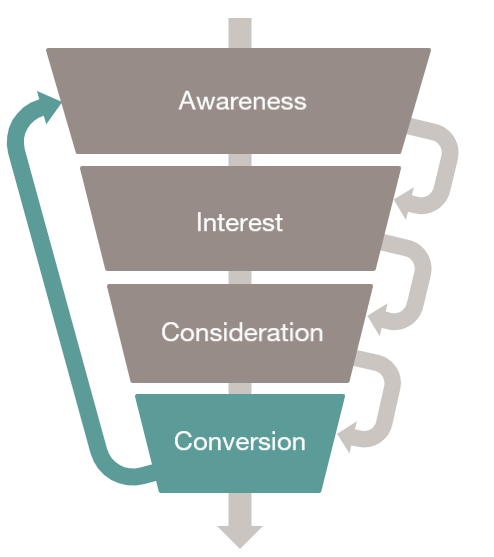
Top of funnel strategies are for marketing to a wide audience to capture as many leads as possible. Since audiences are searching for information at this stage, the primary goals of marketing at the top of the funnel are awareness and lead generation. Some examples of channels used in this stage are CTV/OTT, Streaming Audio, Premium social media (TikTok, Twitter) and Traditional Media such as Billboards, Broadcast, Radio, Print, etc.
The next stage of the marketing funnel is interest or consideration. In this marketing funnel stage, potential customers are aware of your brand and are starting to learn more about it. They may have watched a video about your season or visited your website. Examples of media to support this nurture phase of the funnel are more first party focused tactics in addition to prospecting to known audiences – native advertising, social media such as LinkedIn, Pinterest, Meta), and paid search engine marketing.
Finally, the conversion stage is when a user finally makes the choice to convert or purchase. Your goal is to get as many people as possible from the higher stages of your marketing funnel to this purchase point. It is the final push to get your prospective patron to convert. At this point, focusing on more direct response tactics such as programmatic display banners, social media (Meta), and paid search engine marketing is recommended.
It is also important to consider segmentation – and to prioritize engaged audiences strategically among your first party audiences. Key audiences include CRM Database, Site Visitors, Social Engagers and Cart Abandoners. Did you know, according to Baymard Institute, that almost 70% of shoppers abandon their carts? A MogoARTS recent benchmark report shows an average 8.23% conversion rate on abandoned cart; and $23.91 ROAS (Return on Ad Spend).
Ultimately, consider the timing of your media activation in relation to your patron’s buying patterns. For a late buying audience, deploy top of funnel strategies earlier out from on-stage dates and increase remarketing and bottom of funnel strategies closer to opening. You may also consider running media a few days or weeks into on stage flight to leverage reviews and patron testimonials. Read up on our recent blog on the benefits of annual media planning for other ideas on how to structure your season approach.
TEST & LEARN
Structure clear tests to measure which strategies perform, and scale. Rule number one regarding A/B testing is that all tests should be performed in isolation. Choose one thing – a new channel, headline, call to action, landing page, etc. If you are trying multiple new ideas at once it is impossible to know what was the factor that impacted your test. We also recommend dedicating a testing budget or at least equal budget to A/B test subjects for comparative data and determining a true result. Be comfortable and prepared that all tests have a winner and a loser, and you may not achieve your desired result.
When it comes to measurement, you may be monitoring ticket sales, but it is recommended to log multiple KPIs on a regular basis… you never know what the impact of your test may be! Decide and weigh which KPIs are most important to your organization and continue to check in throughout your test. Depending on what you are planning to measure we recommend looking at historical / organic growth of those KPIs and then setting specific growth goals within scale of past performance. For example, MogoARTS ran a CTV (Connected TV) test with STNJ in Fall 2022 and while the campaign inched closer to the performance opening – ticket sales were not being impacted fast enough. The STNJ team made a decision that branding and awareness coming from CTV was not as important as focusing on ticket sales and decided to pause the video portion of the campaign and reallocate the budget to more direct response strategies.
No matter the patterns you uncover, there are a multitude of unique ways to approach marketing to your audience. Treat every product or performance as an individual challenge and don’t be afraid to try innovative ideas – you just might discover the right combination of media and timing that strikes your audience right!